Prometheus là một ứng dụng giám sát mã nguồn mở và miễn phí được sử dụng để giám sát sự kiện và cảnh báo. Prometheus thu thập, tổ chức và lưu trữ các số liệu theo dõi trong một cơ sở dữ liệu. Ứng dụng này được viết bằng ngôn ngữ Go và sử dụng HTTP pulls để thu thập số liệu từ các máy chủ và ứng dụng từ xa. Nó sử dụng Grafana để hiển thị dữ liệu cho mục đích giám sát và phân tích. Bài viết này sẽ hướng dẫn cách cài đặt Prometheus trên Oracle Linux 8.

Trước khi bắt đầu hãy xem Version của bạn nhé, mình đang sử dụng cho Oracle Linux 9, hướng dẫn này cũng có thể chạy được cho Oracle Linux 7 và 8.
shell>  cat /etc/oracle-release
Oracle Linux Server release 9.3
Tạo một tài khoản riêng cho Prometheus. Bạn có thể làm điều này bằng lệnh sau:
adduser -M -r -s /sbin/nologin prometheusTiếp theo, tạo thư mục cho Prometheus với các lệnh sau:
mkdir /var/lib/prometheus
mkdir /etc/prometheus/
Bây giờ, hãy tải xuống phiên bản ổn định mới nhất của Prometheus bằng lệnh wget:
wget https://github.com/prometheus/prometheus/releases/download/v2.36.2/prometheus-2.36.2.linux-amd64.tar.gzSau khi tải xuống hoàn tất, giải nén file vừa tải bằng lệnh tar:
tar -xvzf prometheus-2.36.2.linux-amd64.tar.gzCấu hình Prometheus.
Sao chép file nhị phân Prometheus từ thư mục đã giải nén sang thư mục hệ thống:
cp prometheus-2.36.2.linux-amd64/prometheus /usr/local/bin/
cp prometheus-2.36.2.linux-amd64/promtool /usr/local/bin/
Sao chép các mẫu và thư viện console của Prometheus sang thư mục /etc/prometheus:
cp -r prometheus-2.36.2.linux-amd64/consoles /etc/prometheus
cp -r prometheus-2.36.2.linux-amd64/console_libraries /etc/prometheus/
Sao chép file cấu hình Prometheus:
cp prometheus-2.36.2.linux-amd64/prometheus.yml /etc/prometheusSử dụng trình soạn thảo nano để chỉnh sửa file cấu hình Prometheus:
vi /etc/prometheus/prometheus.ymlĐây là nội dung mặc định của file này, bạn có thể giữ nguyên nội dung này nếu đang thử nghiệm cài đặt.
# my global config
global:
  scrape_interval: 15s # Set the scrape interval to every 15 seconds. Default is every 1 minute.
  evaluation_interval: 15s # Evaluate rules every 15 seconds. The default is every 1 minute.
  # scrape_timeout is set to the global default (10s).

# Alertmanager configuration
alerting:
  alertmanagers:
    - static_configs:
        - targets:
          # - alertmanager:9093

# Load rules once and periodically evaluate them according to the global 'evaluation_interval'.
rule_files:
  # - "first_rules.yml"
  # - "second_rules.yml"

# A scrape configuration containing exactly one endpoint to scrape:
# Here it's Prometheus itself.
scrape_configs:
  # The job name is added as a label `job=<job_name>` to any timeseries scraped from this config.
  - job_name: "prometheus"

    # metrics_path defaults to '/metrics'
    # scheme defaults to 'http'.

    static_configs:
      - targets: ["localhost:9090"]
Hoặc có thể config lại nó nếu muốn, đây là đoạn cấu hình mẫu của mình.
cat > /etc/prometheus/prometheus.yml << 'OEF'
global:
  scrape_interval: 15s
  evaluation_interval: 15s

scrape_configs:
  - job_name: "prometheus"
    static_configs:
      - targets: ["localhost:9090"]
OEF
Lưu và đóng file, sau đó thay đổi quyền sở hữu của thư mục Prometheus:
chown prometheus:prometheus /etc/prometheus
chown prometheus:prometheus /var/lib/prometheus
Tạo Dịch vụ Systemd cho Prometheus Tiếp theo, tạo một file dịch vụ systemd để quản lý dịch vụ Prometheus thông qua systemd:
vi /etc/systemd/system/prometheus.serviceThêm cấu hình sau:
[Unit]
Description=Prometheus
Wants=network-online.target
After=network-online.target

[Service]
User=prometheus
Group=prometheus
Type=simple
ExecStart=/usr/local/bin/prometheus \
    --config.file /etc/prometheus/prometheus.yml \
    --storage.tsdb.path /var/lib/prometheus/ \
    --web.console.templates=/etc/prometheus/consoles \
    --web.console.libraries=/etc/prometheus/console_libraries

[Install]
WantedBy=multi-user.target
Lưu và đóng file, sau đó tải lại dịch vụ systemd để áp dụng các thay đổi:
systemctl daemon-reloadTiếp theo, bắt đầu và kích hoạt dịch vụ Prometheus với lệnh sau:
systemctl enable --now prometheusBạn có thể kiểm tra trạng thái của dịch vụ Prometheus bằng lệnh sau:
systemctl status prometheusKết quả sẽ là:
$ systemctl status prometheus
● prometheus.service - Prometheus
     Loaded: loaded (/etc/systemd/system/prometheus.service; enabled; preset: disabled)
     Active: active (running) since Thu 2023-12-14 11:10:17 +07; 2s ago
   Main PID: 12381 (prometheus)
      Tasks: 13 (limit: 50477)
     Memory: 23.6M
        CPU: 144ms
     CGroup: /system.slice/prometheus.service
             └─12381 /usr/local/bin/prometheus --config.file /etc/prometheus/prometheus.yml --storage.tsdb.path /var/lib/prometheus/ --web.console.templates=/etc/prometheus/consoles --web.console.libraries=/etc/prometheus/console_libraries

Dec 14 11:10:17 oracleln.hoanghd.com prometheus[12381]: ts=2023-12-14T04:10:17.602Z caller=head.go:542 level=info component=tsdb msg="Replaying WAL, this may take a while"
Dec 14 11:10:17 oracleln.hoanghd.com prometheus[12381]: ts=2023-12-14T04:10:17.672Z caller=head.go:613 level=info component=tsdb msg="WAL segment loaded" segment=0 maxSegment=1
Dec 14 11:10:17 oracleln.hoanghd.com prometheus[12381]: ts=2023-12-14T04:10:17.672Z caller=head.go:613 level=info component=tsdb msg="WAL segment loaded" segment=1 maxSegment=1
Dec 14 11:10:17 oracleln.hoanghd.com prometheus[12381]: ts=2023-12-14T04:10:17.673Z caller=head.go:619 level=info component=tsdb msg="WAL replay completed" checkpoint_replay_duration=82.002µs wal_replay_duration=70.395728ms total_replay_duration=70.882251ms
Dec 14 11:10:17 oracleln.hoanghd.com prometheus[12381]: ts=2023-12-14T04:10:17.674Z caller=main.go:993 level=info fs_type=XFS_SUPER_MAGIC
Dec 14 11:10:17 oracleln.hoanghd.com prometheus[12381]: ts=2023-12-14T04:10:17.674Z caller=main.go:996 level=info msg="TSDB started"
Dec 14 11:10:17 oracleln.hoanghd.com prometheus[12381]: ts=2023-12-14T04:10:17.674Z caller=main.go:1177 level=info msg="Loading configuration file" filename=/etc/prometheus/prometheus.yml
Dec 14 11:10:17 oracleln.hoanghd.com prometheus[12381]: ts=2023-12-14T04:10:17.902Z caller=main.go:1214 level=info msg="Completed loading of configuration file" filename=/etc/prometheus/prometheus.yml totalDuration=227.829439ms db_storage=1.094µs remote_storage=2.835µs w>
Dec 14 11:10:17 oracleln.hoanghd.com prometheus[12381]: ts=2023-12-14T04:10:17.902Z caller=main.go:957 level=info msg="Server is ready to receive web requests."
Dec 14 11:10:17 oracleln.hoanghd.com prometheus[12381]: ts=2023-12-14T04:10:17.902Z caller=manager.go:937 level=info component="rule manager" msg="Starting rule manager..."
Mặc định, Prometheus lắng nghe trên cổng 9090. Bạn có thể kiểm tra bằng lệnh sau:
shell> ss -antpl | grep 9090
LISTEN 0      4096               *:9090            *:*    users:(("prometheus",pid=12326,fd=7))
Bây giờ bạn có thể kiểm tra trang web Prometheus bằng URL http://địa-chỉ-ip-của-bạn:9090. Bạn sẽ thấy bảng điều khiển Prometheus trên trang này.

Bây giờ, bạn đã cài đặt và cấu hình Prometheus thành công! Hãy tham khảo tài liệu Prometheus để biết thêm chi tiết về cách sử dụng và cấu hình nâng cao.
Cài đặt Node Exporter.
Để thu thập được Metric cho Linux bạn cần một công cụ có tên là Node Exporter. Việc cài Node Exporter trên Oracle Linux có thể áp dụng theo bài này https://wiki.hoanghd.com/cai-dat-node-exporter-de-thu-thap-thong-tin-cho-prometheus/.
Sau khi cài đặt xong bạn có thể sử dụng systemctl status node_exporter để xem trạng thái của Node Exporter.
shell>  systemctl status node_exporter
● node_exporter.service - Node Exporter
     Loaded: loaded (/etc/systemd/system/node_exporter.service; enabled; preset: disabled)
     Active: active (running) since Thu 2023-12-14 11:16:41 +07; 2min 26s ago
   Main PID: 12559 (node_exporter)
      Tasks: 5 (limit: 50477)
     Memory: 6.8M
        CPU: 31ms
     CGroup: /system.slice/node_exporter.service
             └─12559 /usr/local/bin/node_exporter

Dec 14 11:16:41 oracleln.hoanghd.com node_exporter[12559]: ts=2023-12-14T04:16:41.898Z caller=node_exporter.go:117 level=info collector=thermal_zone
Dec 14 11:16:41 oracleln.hoanghd.com node_exporter[12559]: ts=2023-12-14T04:16:41.898Z caller=node_exporter.go:117 level=info collector=time
Dec 14 11:16:41 oracleln.hoanghd.com node_exporter[12559]: ts=2023-12-14T04:16:41.898Z caller=node_exporter.go:117 level=info collector=timex
Dec 14 11:16:41 oracleln.hoanghd.com node_exporter[12559]: ts=2023-12-14T04:16:41.898Z caller=node_exporter.go:117 level=info collector=udp_queues
Dec 14 11:16:41 oracleln.hoanghd.com node_exporter[12559]: ts=2023-12-14T04:16:41.898Z caller=node_exporter.go:117 level=info collector=uname
Dec 14 11:16:41 oracleln.hoanghd.com node_exporter[12559]: ts=2023-12-14T04:16:41.898Z caller=node_exporter.go:117 level=info collector=vmstat
Dec 14 11:16:41 oracleln.hoanghd.com node_exporter[12559]: ts=2023-12-14T04:16:41.898Z caller=node_exporter.go:117 level=info collector=xfs
Dec 14 11:16:41 oracleln.hoanghd.com node_exporter[12559]: ts=2023-12-14T04:16:41.898Z caller=node_exporter.go:117 level=info collector=zfs
Dec 14 11:16:41 oracleln.hoanghd.com node_exporter[12559]: ts=2023-12-14T04:16:41.928Z caller=tls_config.go:274 level=info msg="Listening on" address=[::]:9100
Dec 14 11:16:41 oracleln.hoanghd.com node_exporter[12559]: ts=2023-12-14T04:16:41.928Z caller=tls_config.go:277 level=info msg="TLS is disabled." http2=false address=[::]:9100
Hoặc bạn cũng có thể dùng lệnh ss -antpl | grep 9100 để xác nhận port 9100 đã hoạt động.
$ ss -antpl | grep 9100
LISTEN 0      4096               *:9100            *:*    users:(("node_exporter",pid=12559,fd=3))
Cấu hình Node Exporter.
Thêm nội dung sau vào file /etc/prometheus/prometheus.yml.
  - job_name: 'node_exporter_metrics'
    scrape_interval: 5s
    static_configs:
      - targets: ['SERVER-IP:9100']
Ví dụ.
cat >> /etc/prometheus/prometheus.yml << 'OEF'
  - job_name: 'node_exporter_metrics'
    scrape_interval: 5s
    static_configs:
      - targets: ['localhost:9100']
OEF
Sau khi thêm file /etc/prometheus/prometheus.yml sẽ có nội dung kiểu như sau.
global:
  scrape_interval: 15s
  evaluation_interval: 15s

scrape_configs:
  - job_name: "prometheus"
    static_configs:
      - targets: ["localhost:9090"]

  - job_name: 'node_exporter_metrics'
    scrape_interval: 5s
    static_configs:
      - targets: ['localhost:9100']
Khởi động lại Prometheus.
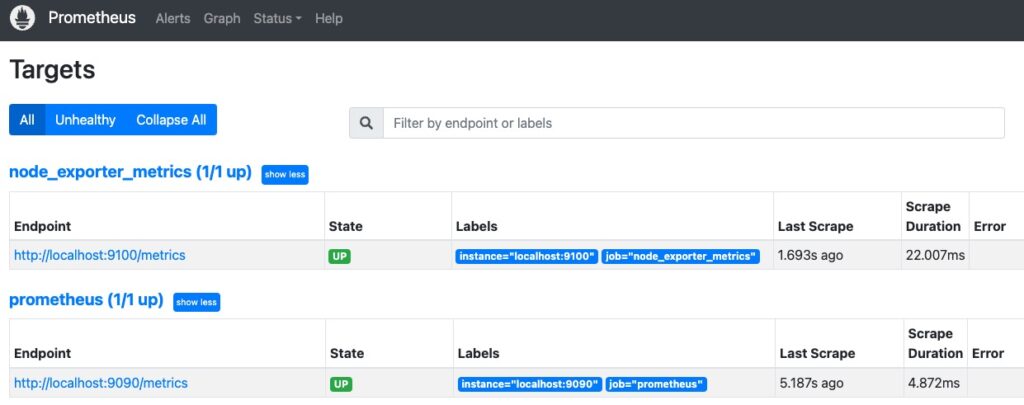
systemctl restart prometheusBây giờ, hãy mở bảng điều khiển Prometheus của bạn và nhấp vào Status -> Targets. Bạn sẽ thấy hai endpoint:
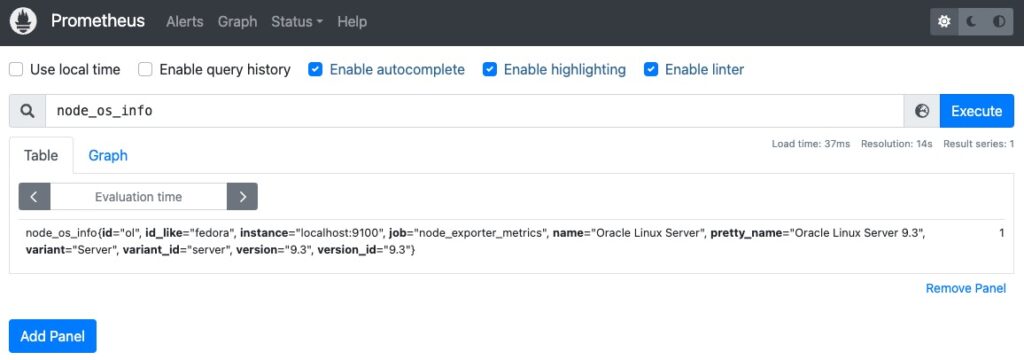
Tiếp theo, bạn có thể truy vấn PromQL “node_os_info” trên thanh tìm kiếmbạn sẽ thấy thông tin chi tiết về hệ điều hành hiện tại của bạn.
Lưu ý: Các hướng dẫn trên dựa trên phiên bản Prometheus 2.36.2. Các phiên bản khác có thể có các chi tiết khác nhau.
Tài liệu tham khảo https://www.atlantic.net/dedicated-server-hosting/how-to-install-prometheus-system-monitoring-tool-on-oracle-linux-8/.